
Your spreadsheet knows where your people are. Now see it.
District Mapper turns a list of members, clients, or supporters into a map of the legislative and school districts they live in — with the breakdown your team, your board, and your representatives can actually read.
No signup, no card. Upload a file or explore 450 synthetic records in one click.
See where your people are.
Every record placed in its congressional, state, school, and council districts — automatically.
Get numbers you can act on.
A clean breakdown of how many of your people are in each district, exportable in one click.
Share it with anyone.
Plain-language summaries, branded PDFs, and district one-pagers made to be forwarded.
From spreadsheet to district map in three steps
Upload your list.
CSV or Excel, one row per person. Addresses get converted to map coordinates automatically; if you already have coordinates, that step is skipped entirely. Before anything is saved, you review exactly what was detected in your file and decide what happens to any personal information.
Pick a boundary layer.
Congressional districts, state senate and assembly, school districts, tribal areas, city council districts for 16 major cities. One click loads the boundaries, runs the analysis, and shades every district by how many of your records fall inside it.
Read, explore, export.
| District 12 | 340 |
| District 07 | 214 |
| District 09 | 176 |
| District 03 | 128 |
A breakdown table shows your count in every district. Click any district to see how your own data fields distribute inside it. Export your enriched spreadsheet, a PDF report, or a district one-pager.
No GIS experience required. If you can maintain a contact list, you can use District Mapper.
340 people in one district is a number. Who they are is a story.
Click any district and District Mapper charts how your own fields distribute inside it — program, enrollment status, engagement, whatever your spreadsheet holds. Identifying columns like names and emails are never charted. Advocate accounts can customize the view — choose which charts appear, how they're drawn, and in what order — and the layout is saved with the dataset.
Districts with fewer than ten records show a total only, never a breakdown. Small groups are identifiable in ways large ones are not — the tool protects them by default.
The paragraph you'd paste into a board update — written for you.
Instead of reading a table of district counts, get a narrative description of where your people are concentrated and how they're spread, written for non-technical readers. Built for the moment you need to explain your geography to someone, not just look at it.
Personal information never reaches the AI. It sees geographic distribution and non-personal fields only — no names, no addresses, no emails, and nothing you've encrypted.
Your 1,120 members concentrate heavily in Congressional District 12 (340) and District 07 (214), which together hold roughly half of your list. The remaining members spread thinly across seven districts, with fewer than 20 in District 09's northern edge. Your footprint is dense in the urban core and sparse along the outer ring.
Built for the meeting you're walking into.
One district, one page: your counts, your charts, your organization's name and logo, and the representatives serving that district with their party affiliation. Edit the title, toggle the numbers and charts, add a notes block for context or an ask — then export to PDF for the board packet, the funder conversation, or the legislative visit.
Personal information never appears on a one-pager. It's made to be forwarded, and that's the safest default.
From "here are our districts" to "here are the bills affecting them."
Describe your organization's mission once, and Policy Pulse searches your state's current legislation for bills touching your work, scores each for relevance, and surfaces the strongest matches — enriched with the districts and representatives involved, so you know who to talk to.
Coverage spans state legislatures nationwide, powered by Open States legislative data.
Extends emergency rental assistance funding and eligibility through 2027 for low-income households.
Establishes competitive grants for regional food banks and mutual-aid networks.
The safest data is the data you never stored.
District Mapper is used by organizations holding sensitive information about people who didn't choose to be in a database. So the tool asks what you want kept — before it keeps anything.
You decide what's stored — before it's stored.
On upload, the tool shows you which columns look like personal information and what will happen to each. Keep it, discard it, or encrypt it — per column, per upload, or as a standing policy for your whole organization.
Addresses can do their job and disappear.
Choose "discard" and an address is used to place the point on the map, then thrown away. The coordinates stay; the street address is never saved.
Two things we will never store.
If a column looks like Social Security numbers or bank account details, it is refused. Dropped, clearly reported, no override, no tier that unlocks it. A mapping tool has no use for either.
Small numbers are protected.
Any district with fewer than ten of your records shows a count, never a category breakdown — on screen and in every export. Small groups can be identified; the tool assumes they shouldn't be.
Personal information never reaches the AI features, and never appears on a one-pager.
Your data is yours. It runs your analysis and reloads your datasets. It is not sold or shared.
Not ready to upload your own list? Borrow ours.
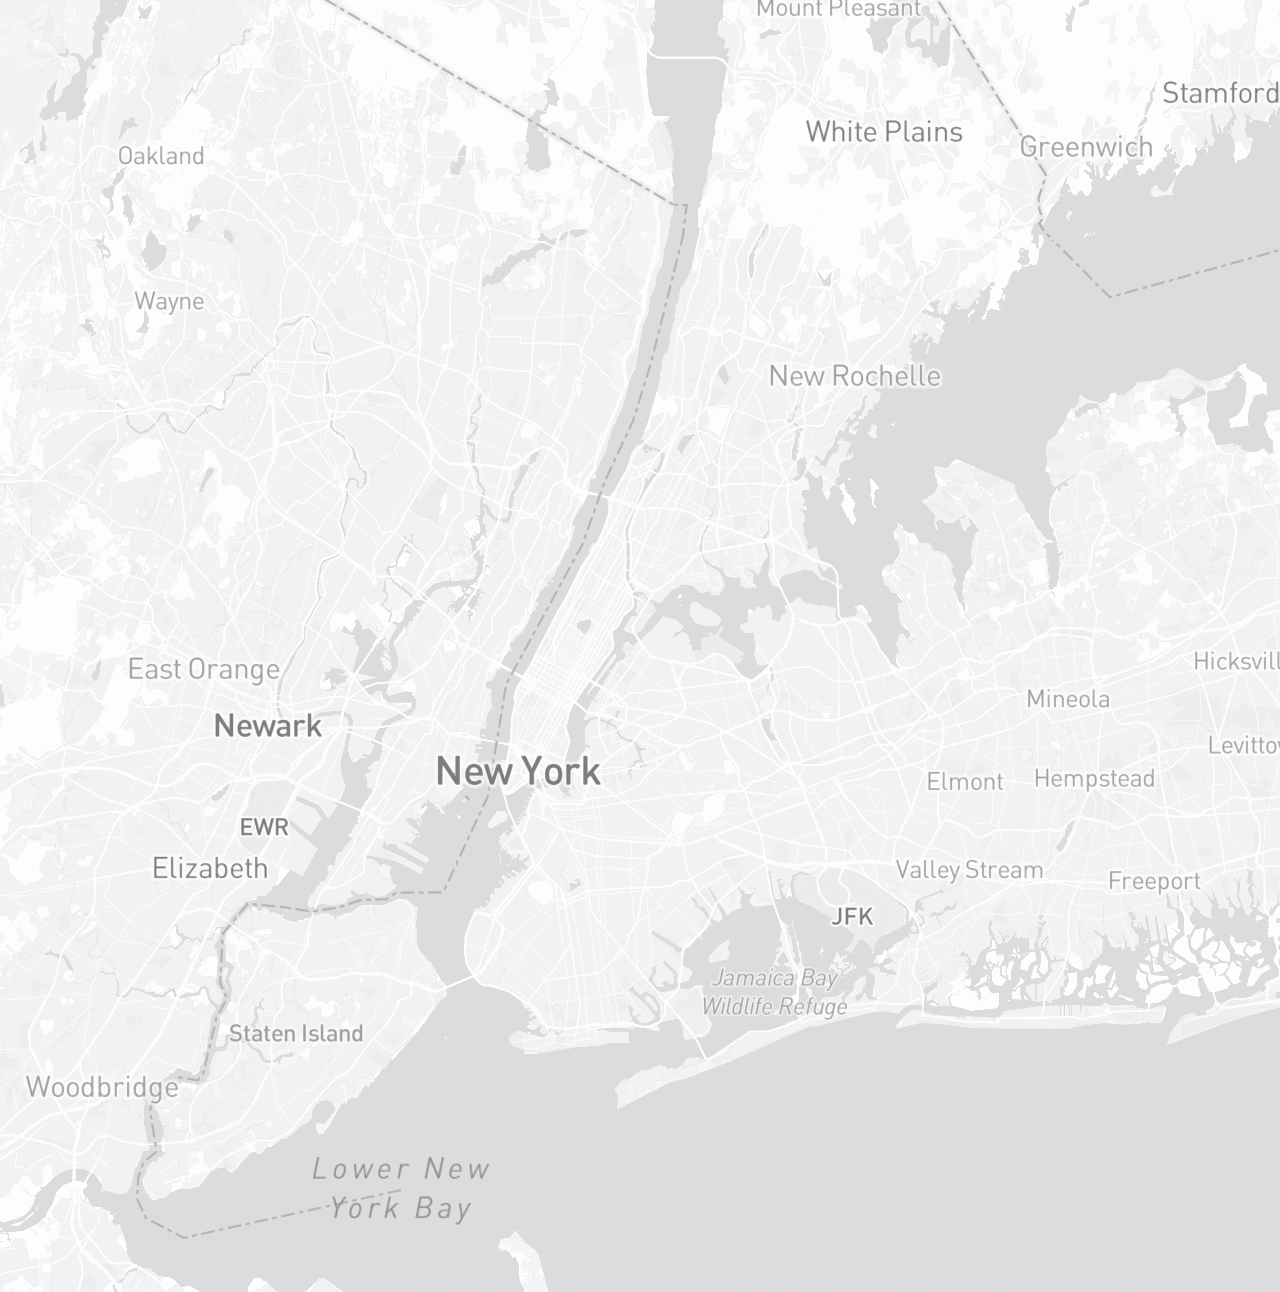
Load the built-in demo — 450 synthetic members of a fictional NYC-area social services organization, spread across the five boroughs, the outer ring, and a few New Jersey records. Every name, address, and email is invented; no real person or residence is represented. Explore every feature with realistic data before touching your own.
Every tier sees every map. You pay for capacity and reporting, not geography.
All boundary layers are available on every tier, including free. Paid tiers add scale, AI summaries, exports built to share, and legislative tracking.
How the row limits work: the address limit applies to rows that need geocoding; if your file already has latitude/longitude columns, you get the much higher coordinate limit — and no address ever leaves the tool.
Overflow is honest: if a file exceeds your limit, the tool analyzes up to the limit and tells you exactly how many rows were left out. Nothing is dropped silently.
Annual: $800/year works out to about $67/month — the better value if you'll use it more than ten months a year.
Have a premium code from North Arrow? Redeem it in your account for immediate Advocate access — no card required.
See your people on a map in the next two minutes.
No account, no card, no sales call. Upload a spreadsheet — or load the demo — and watch it become districts.